

Why Did It Take Inflation So Long To Show Up?
Here's the YouTube talk I gave on Jun17, 2022, followed by a lightly edited transcript for those who prefer to read. If you enjoy either, please hit the "like" button at the end. Thanks!

ARC-TV June 17 2022
WHY DID CPI INFLATION TAKE SO LONG TO SHOW UP?
Hello everyone, welcome to Finance Friday. I’m HardmoneyJim, investigating money creation and its consequences. We are back in southern California again this Friday, where gas prices here on my little island of Coronado (near San Diego) are among the highest in the country at well over $6 per gallon. Rising gas prices are just one of the obvious consequences of excessive money creation as all consumer prices are rising on the back of the extraordinary money creation by the banks and the Fed that we saw during the Coronavirus pandemic.

I don’t know when gas prices will top out or moderate, but some good analysis I have seen indicates oil prices must go as high as $130 to %180 per barrel before there is a significant negative effect on demand. And of course, the price of crude oil is passed through to the price of gasoline, so we’ll have to wait and see.
By the way, I am old enough to remember when I was in pilot training in Laredo TX, in 1971, and gas prices were 23 cents per gallon. So I ask you, what has changed, what is different today – the money or the oil? The money or the gasoline?
Today I want to do two things. First, I want to update you on the state of inflation in the USA, inflation’s effect on the asset markets, and on the public’s general attitude toward inflation in the country. And we’ll see that both the facts about consumer prices and the level of public concern in the country have gotten worse since we last spoke about 3 weeks ago. So I’ll just say in advance – I really don’t have any good news about inflation today.
Then, after that inflation update, I want to dive into a question, a problem, that many people have asked about. And that question is this: I (and many others) claim that across-the-board price increases – what some call “inflation” – are caused by an undue increase in the money supply which in turn is caused by government policy or direct government action. In fact, I say inflation properly defined IS an undue increase in the money supply caused by the government.
But there is an apparent statistical problem with that claim. We had very high money supply growth for years, from 2010 to 2020, before we got significant increases in consumer prices. For years, this money supply increase did not show up in higher consumer prices to the extent one would have expected. And this faked out the Fed, who thought they could continue their QE money creation program without causing consumer price inflation.
Now, why was that, how could that happen? How could we have rapid money supply growth and fairly low consumer price inflation for so many years, between 2010 and 2020? I will take a stab at explaining that today, and I hope you’ll find my explanation interesting.
PART ONE: UPDATE ON CONSUMER PRICE INFLATION
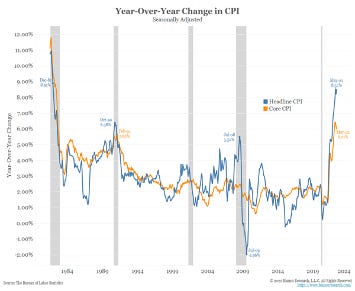
But first, let’s do an update on headline inflation, the number everyone talks about, the Consumer Price Index. Here is the standard chart I normally show. The current annual rate of increase in consumer prices is on the far right and it just hit a 40-year high of 8.6%, up from April’s 8.3%. Most commenters were expecting that number to peak and moderate a little bit - 8.2% was the consensus forecast, and most of the talking heads were surprised that it just got worse.
So just how bad is consumer price inflation? It might be even worse than these numbers indicate. Larry Summers, the former Treasury secretary under Bill Clinton and now an influential economist at Harvard, has reconstructed consumer price inflation using the same methods that were used in the 1980s, before the government altered its calculating methods to account for product quality and substitution effects. Summers calls this calculation a “constant methodology synthetic CPI.” By this measurement system, consumer price inflation today is close to the all-time high set in March 1980 of 11.44%.
So If we measured inflation as we used to, back in the 80s, inflation is higher now than it was in the worst year of the 70s and 80s.
Then there is the question of what the public thinks of inflation. They are more concerned than they have ever been. We need to remember, that the Fed has a two-fold mission as defined by Congress. The Fed’s two objectives are to maintain full employment and maintain stable prices. So it’s unemployment and inflation they are primarily concerned about. Unemployment, when it rises, affects a small percentage of people. It’s unfortunate for those affected, but when unemployment goes from, say, 4% to 8%, only 4% of the people are affected. But consumer price inflation, which is a loss of purchasing power, affects everyone from Bill Gates to welfare recipients and everyone in between. It affects everyone. That is why I have repeatedly said inflation is a political hot potato like no other. And average citizens are very concerned about it.
Here is the latest consumer confidence survey which has been published for many years by the University of Michigan.

Last Friday, June 10, this measure hit its lowest level in its 70-year history. So the lowest consumer confidence level in history wasn’t after 9/11, or the dot-om crash, or due to the Great Financial Crisis, or any of the many wars we have been involved in. The worst day for consumer confidence was last Friday, June 10, when CPI surprised everyone and came in at 8.6%. That is an indication of how serious consumer price inflation is to people, and why it is top of mind in all surveys when people are asked about their concerns. Their concerns are not about climate change or the border or the capital riot or the Ukraine war near as much as their concern about their cost of living. All the surveys, some of which I have cited in the past, confirm this.
There’s also evidence that even high earners, especially those in the millennial group, are feeling vulnerable to consumer price inflation. One survey says that 63% of millennials (people born from 1981 to 1996) earning up to 4150,000 per year are living paycheck to paycheck. They don’t have much wiggle room except to cut back on their expenses.

If you need another measure of economic hardship on the middle class, look at the monthly cost of a mortgage for the first-time home buyer, now at an all-time high due to sharply higher mortgage rates, now around 6%:

In addition, according to research out of the Atlanta Fed, inflation is becoming more entrenched in consumer prices, looking more and more like it is here to stay for a while.

Researchers at the Atlanta Fed divide the elements of the CPI into “flexible” prices and “sticky” prices. So-called “sticky” prices are items whose prices respond more slowly but persistently over time to add to the CPI index increase. These are things like shelter costs, utilities, public transportation, insurance, and so on. And you can see from the Atlanta Fed’s chart here that the sticky price contribution to CPI, the ones in orange, are rising rapidly since 2021. Sticky prices now account for almost 4% of the CPI increase, up from 1% 18 months ago, so they now account for nearly half of the headline 8.6% number.
So this consumer inflation we are in does not appear to be a temporary flash of volatile or flexible prices like food and energy, it appears to be more embedded in the economy and it will be with us for a while.
The stickiest prices of all are in shelter costs. Here we see the difference between new rental rates as reported by Zillow and what the government CPI numbers say. Given the 6-mnth lag between new rental rates and when they are reported in the CPI, I expect CPI shelter costs to rise a lot more in the coming months.

Other surveys show future inflation expectations are up among both consumers and investors, indicating the “transitory” sentiment, the thought that consumer inflation will soon moderate, is now largely gone, and people are realizing consumer inflation is a fact of life.
The market reaction to this increase in CPI has been to sell everything from stocks to bonds to crypto and even precious metals. Everything is being liquidated, although gold and silver so far are down less than most other assets. In general, though, virtually all investments are selling off.
One last point I should make is that our government’s reaction to this inflation problem continues to be what I have to call a “clownish denial.” It is not helpful because it is not credible. Joe Biden has repeatedly referred to the current inflation as “Putin’s price hike.” In fact, the price pressures caused by the Ukraine war are very minor in the total scheme of things. For example, if you want to know why gas prices are so high, here’s one good reason:

High fuel prices should generate a supply response, but our energy industry is not being allowed to drill for fossil fuels. The US rig count is a fraction of what it was a few years ago. We are simply not exploring enough for new oil and gas, and the reasons are all because of government restrictions. In addition, gasoline refinery capacity is down to its lowest level in many years despite increasing demand. We have not significantly added to refinery capacity in this country since the 1970s. But this is not the fault of Vladimir Putin, so don’t be fooled by that claim.
OK, that is enough bad news on the inflation front. Let’s pause here for some questions or “superchat” comments.
WHY DID CONSUMER PRICE INFLATION TAKE SO LONG TO SHOW UP?
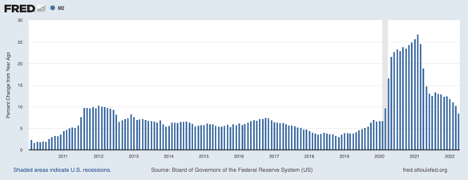
The big thought question we want to answer today is, why did this terrible consumer price inflation seem to appear all of a sudden, almost out of nowhere? Years of high money supply growth (an average of 8% annually from 2010 to 2020 before the big money supply explosion shown on the right side of the chart) resulted in high asset prices, but consumer prices stayed subdued. How could they pump money at the economy for so many years without causing troublesome increases in consumer prices?
I am going to offer two reasons - a monetary reason and an economic reason. But before we get into that, let’s first review the Fed’s definition of inflation. The Fed says “inflation” is simply an increase in consumer prices. So, an upward movement of an index of consumer prices is the Fed’s public definition of inflation. (Here I show the CPI. The Fed uses a slightly different measure, the PCE deflator, but it is very close to the CPI, shown here, which is computed by the BLS.)

Some people (me included) say this policy of 2% inflation is fraudulent because the Fed’s mission is to provide both stable prices and low unemployment. Yet they define a built-in 2% inflation as “stable prices.”
Why is 2% their goal? Where did they get this 2% inflation goal? I finally found the answer to this question from an interview with Judy Shelton, a conservative economist, and former Trump advisor. The story she told was that back in 1996 Janet Yellen convinced Alan Greenspan that targeting consumer inflation at 2% was a good idea. The idea came from Yellen’s husband, the economist and Georgetown University professor George Ackerloff.
Their rationale for this is that a 2% annual increase in wages and prices is low enough that most people will not be concerned. 2% is low enough to avoid a massive inflation mindset or strong inflation psychology. If the people don’t care, it is not really inflation, so they think.
The Fed economists also think the public is psychologically very averse to declining wages. They think a pay cut will cause major unrest among labor unions and other advocates. Very simply, no one likes a pay cut especially during a recession.
So, imagine your wages are increasing nominally at 3% a year. But the Fed depreciates your money at 2% per year, so you are only getting a 1% real annual increase. Then along comes the economic downturn, and wages only go up only 1% nominal. But inflation is 2% so even though you have really gained 1% in real terms, the Fed thinks you won’t notice this because they think you don’t care about it, or that you will not notice a 2% annual depreciation of your currency.
It is a psychological gambit. It is an example of the money illusion, where people think just because they are getting the same amount of dollars, they still have as much money as before, even though they have lost purchasing power to inflation.
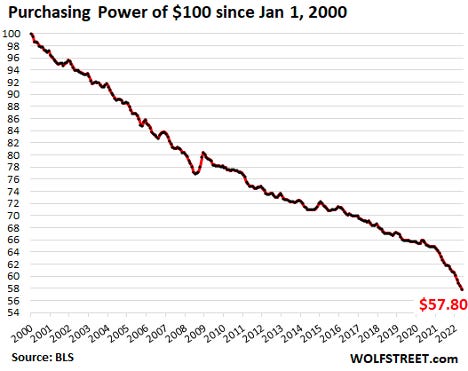
Just for fun, here is another look at the Fed’s notion of “low inflation.” Using the CPI as a measure, $100 dollars obtained in the year 2000 would buy goods worth $57.80 today.
The point of this diversion into the Fed’s bizarre definition of “no inflation” or “stable prices” is that the very notion that there was “no consumer inflation” for years was a lie. Inflation was always there, wearing away the value of your dollar. The Fed didn’t want you to notice it.
Apparently, the Fed thinks we, the people, are like frogs in a pot that is slowly heating up. We will not notice a 2% decline in purchasing power, even though over time it hurts lots of people. Instead, we will just relax in that pot called currency devaluation. And when the downturn comes we’ll believe it didn’t get worse because nominal wages did not go down.
So the Fed’s measure of “inflation” is, first of all, deceptive because it claims real monetary depreciation of 2% annually is not really currency depreciation, it is not really “inflation.”
But it is even worse than that because consumer prices do not measure some of the important things you spend your money on. CPI increases can be low but other costs can be inflating very rapidly, and the Fed will still claim there is no inflation.
A prime example is the cost of acquiring assets for saving. To provide for your future, you probably want to buy a house or own stocks and bonds or just open a normal savings account and put away money every month out of your paycheck. But stocks and bonds and house prices and savings accounts are not in the CPI. If you look at a list of items in the CPI you will find no entries that reflect the cost of saving for your future, or the cost of buying a house or the cost of buying shares in your 401K.
These are things you need to spend money on but they are not on the CPI list, and you, lowly consumer, are not supposed to consider asset price inflation as important to your regular cost of living. However, you should be concerned if you are a rational person preparing for your future. But because of the Fed’s asset bubble, asset prices are so high that it is going to take you 3 times more money per month to build up a nest egg.
So I say we have had inflation for a long time, it has just been much more evident in assets and less evident in consumer prices. But now we should answer, why was this?
PART TWO: WHY DID CONSUMER PRICE INFLATION TAKE SO LONG TO SHOW UP?
Let’s first take a look at what asset prices did during the QE years. Since QE started in late 2010, asset prices have soared but consumer prices were fairly subdued.
During that same period, real GDP – a measure of real physical production – grew by about 2.3% per year. Nominal GDP grew at nearly twice that rate, about 4.5% annually.
But nominal GDP and money supply are normally closely connected, so you would have expected nominal GDP growth to be much closer to the 8% annual increase in the money supply. Clearly most of that new money pouring into the economy from 2010 to 2020 was not fueling GDP activity or CPI activity. Where was all that new money going?
Much of the new money went into the stock market, the bond market, and the housing market.
In the 10 years 2010 to 2020, stocks went up 250%. And they went up another 70% during what I call “Pandemic QE.”
Lots of that money also went into the housing market.
House prices went up 33% during the first 10 years of QE, and up another 35% during the previous two years of Pandemic QE.
Overall, in the full 12 years of QE, from 2010 to 2022, here are the relevant numbers:
M2 money supply increased 149%. That growth was 8% per year until it exploded in 2021 and 2022, for an overall average annual growth over the 12 year period of 12%.
The Consumer Price Index increased 27.5%. Half of that rise came in the last 18 months along with the upward explosion in M2.
The S&P 500 index increased 275%, that’s even after the recent 22% sell-off.
The median home price increased 77%.
The gold price increased 60%.
Clearly, you won if you owned assets and you lost if you held cash.
I want to explain why this asset inflation happened. And I say it was mainly due to QE, pure new money creation, that was directed more toward asset purchases than at consumer goods.
To see how this worked, we first must get clear on why the price of anything rises. We’ll use my usual cigar store example to explain.
Suppose customers at my local cigar store spend $5000 per week to buy 500 cigars per week, for an average price per cigar of $10. It is mathematically required that the average price depends on the demand ($5000) divided by the supply (500 cigars). So if in the first week, customers buy 500 cigars per week and spend $5000, the average price is $10 per cigar. If in the second-week customers bring more money to the store to spend $10,000 per week, the average price will go to $20/cigar. Furthermore, if the price is going to rise further after that, this will require even more new money to be spent at the cigar store in subsequent weeks.
So, assuming the volume of cigars sold does not decline, the only way for prices to keep continually rising is if new money is continually spent in the cigar store – more money than was spent in the previous period. If the same money is spent on the same number of cigars, the average price cannot rise.
It is the same for share prices in the stock market. If share prices keep rising on equal or rising share volume, it must be true that more money was spent on stocks to create those higher prices.
It is the same with house prices. If the volume of home sales stays equal or increases, and house prices keep going up, the only way for this to happen is if more money is spent in the housing market in each successive period.
It is the same with all markets. Butter, eggs, beanie babies, you name it. If the number of units sold is not declining, and more money is being spent on the goods in question, you can only get higher prices. So for stocks and housing to continue to rise, clearly there was a continuing flow of additional, new money flowing into the stock market and the housing market.
So now we are going to explore the major source of the new money entering these markets which I say was due to QE done by the banking system and the Fed. As we’ll see, both commercial banks and the Fed are involved in QE).
First, recall what QE is. It is a joint operation by the commercial banks and the central bank (the Fed) to create new money. First, money is created in the form of a bank deposit by commercial banks when they buy bonds. Next, these bonds are bought from the bank by the Fed and paid for with new bank reserves. So the result of QE is that both new money (M2) in the form of bank deposits is created, AND new reserves are created when the Fed takes possession of the bonds. Usually, these transactions are done simultaneously. The effect is that the Fed uses the banks a “pass-through” entity to buy bonds.
Here is a quote from the Bank of England describing QE:
Many economists, even famous ones, make the mistake of saying that QE creates only new bank reserves, but not new spendable money (M2). This is incorrect and the error has caused much misunderstanding. The fact is, QE always produces BOTH new spendable money and new bank reserves.
Just so you don’t think either I or the Bank of England are making this up, I’ll read you another quote, this time from a Federal Reserve publication. The author, a Fed economist, is describing standard open market operations, which are operationally the same as QE, except they are done on a much smaller scale, but the mechanics are identical.
“When the Federal Reserve wants to increase bank reserves…it contacts dealers or financial institutions that are willing to sell their government securities. In exchange for the securities, the Federal Reserve credits the financial institution’s commercial bank with additional bank reserves equal to the value of the securities. The commercial bank, in turn, credits the institution’s account. [here is the key passage] The net result is that the Federal Reserve has more government securities, the commercial bank has larger reserves, and the dealer has larger deposits with the commercial bank. Both bank reserves and the money stock have increased. “
- Scott Hein, Federal Reserve Bank of St Louis, March 1981
So to hammer this home, let’s visually follow a QE transaction to see how it works . This diagram is from the Bank of England’s quarterly bulletin from Q1 2014.
We are going to look at the assets and liabilities of three entities. The first entity is a pension fund (top row) that owns a government bond, labeled government debt. (Instead of a pension fund, this could be any institution that owns government bonds, any so-called savings institution, like a mutual fund or a hedge fund or an insurance company or brokerage company, or any other non-bank financial entity.)
The second entity, second row, is the central bank which has various “other” assets and bank reserves as liabilities.
And the third entity is the commercial bank, with bank reserves as assets and liabilities in the form of bank deposits, or money.
Money, which is a bank deposit and a bank liability, is shown in the red boxes. Reserves, or deposits at the Fed, are in green. On the left side of the diagram are the assets and liabilities of each of these three entities before QE. On the right side are their assets and liabilities after QE.
Start at the top with a pension fund that owns a Treasury bond (labeled government debt). Let’s say the Fed is not happy with the amount of money the banks are creating through lending so it decides to take matters into its own hands.
The Fed contacts the pension fund and offers to buy the bond. The pension fund agrees.
The Fed directs the commercial bank, which it regulates, to purchase the bond from the pension fund.
The bank completes the purchase, paying for it with a new bank deposit. This creates a deposit in the pension fund’s bank account, creating new spendable money that did not exist before. This is the moment of new money creation. This new bank deposit is now an asset (cash) of the pension fund and a liability of the commercial bank.
The central bank immediately buys the bond from the bank, paying with new bank reserves.
(In QE, this central bank transaction is simultaneous with the commercial bank purchase, which is why the government bond does not show up on the commercial bank’s asset account. If the bank had bought the bond from the pension fund on day 1 and the had Fed bought the bond from the bank on day 2, the bond would show up as an asset of the bank on day one, then the bond would be replaced by new bank reserves on day two. When the entire transaction is done, new bank reserves become both an asset of the commercial bank and a liability of the central bank.)
What is happening here is, the central bank is providing a new source of demand for bonds, which tends to raise bond prices and lower market interest rates.
The pension fund now has money to spend instead of an interest-bearing bond to collect interest on.
So the pension fund must now look for a replacement investment – after all, it must earn interest to meet its obligations to its pensioners. Let’s think, what will that pension fund do with this chunk of new money? What would any savings institution do with it? These savings institutions – pension funds, mutual funds, hedge funds, ETFs, insurance companies, brokerage firms - do not buy butter or eggs or cars. They buy financial assets, mostly stocks and bonds, as investments. Hedge funds are now even buying up single-family houses, in bulk. They are doing this with new money. When the price of their investment rises and is sold, they buy more investments at higher prices, which they can do because as the Fed balance sheet expands, these institutions are regularly getting new, additional money, so asset prices keep rising.
So there it is. New money has entered the investment market, just like the new money that entered our cigar store. When the banks and the Fed engage in this activity on a sustained basis over many years, they build up a huge new source of demand in the stock market that was never there before.
How much new money was directed into the stock and bond market in this way? Just look at the Fed’s purchase of Treasury securities over time.
The graph shows the Fed’s holdings of US Treasurys. Look at the jump in 2010, 2012, 2014, and of course the big push in 2020. Every dollar the Fed spent on Treasurys was matched by new money in the commercial banking system (M2 or broad money) most of it injected into the investment markets.
In 2010 the Fed held less than a trillion dollars in Treasury bonds. Today they own nearly 6 trillion a nearly $5 Trillion increase. Most of this $5 Trillion increase represents new money sloshing around in the investment markets. And the Fed bought a lot more than Treasurys, it also bought mortgage backed bonds.
The only time the new QE money leaks out into public spending that would affect the CPI is through things like higher salaries for the pension employees, or in distributions paid to pensioners, which will then be spent on CPI items. But these are only a fraction of the pension’s asset value each year. Hedge fund profits can be huge, but most of this money is also reinvested in assets. Some of the gains are spent on super yachts or large private jets or large land holdings. But most of the new money stays in the investment world, where the participants use that new money to purchase investment assets, continually raising asset prices and lowering interest rates.
Now, we can begin to see why this new source of money stayed mostly in the investment markets and raised asset prices, and did not immediately leak out into commodities or consumer goods in the form of soaring prices.
Let’s look at another similar money transmission mechanism, in this case, house prices, through the mortgage-backed securities market.
Here is a graph of the Fed’s holdings of mortgage-backed securities. Banks create new money when they “lend” you money for a house. The banks then aggregate these loans and sell them to Freddie Mac or Fannie Mae, who pool them into a fund and then issue bonds based on that pool of mortgages. This is all done to mitigate the risk of owning individual mortgage loans, and it is a good system.
Next, various savings institutions invest large amounts of money in these mortgage pools. Now the Fed steps in, purchasing large quantities of these mortgage-backed bonds, creating new money in the QE process just like they do when they buy Treasurys. The extra demand drives mortgage interest rates down. The Fed purchasing program takes these bonds out of the market, creating an appetite for more new mortgage-backed bonds, more mortgages at ever lower rates.
The increasing supply of mortgage money at lower rates causes homeowners to bid up the prices of houses, which they can easily afford as long as interest rates stay very low.
New mortgage loan formation – i.e. new money creation – is a lucrative business for banks, so they keep creating more loans (creating more money) knowing they can offload those loans to the Fed at a profit, setting them up to repeat the process again and again. These loans carry very little risk of default because of government guarantees and the Fed’s willingness to buy them.
This is how demand for homes keeps rising. It is because of the continual creation of new money used to buy these homes, new money that enters the housing market. This is the only explanation I know that can explain the meteoric rise of house prices across the country over the last few years.
Now, let’s return to the CPI for a moment. Its components are shown here. About 70% of GDP is transactions that count only the personal consumption of goods and services – the same items that are in the CPI: food, fuel, shelter costs, medical care, etc. When you think about the new money being spent on financial investments I have just described, is any of that new money going into CPI items? I would say, practically none. Look at the list. When you buy a home, or when you or any institution purchases stocks or bonds, those transactions are not counted in CPI or GDP, so they will not bid up prices of items in the CPI.
So for years, the prices of items in the GDP and the CPI were not being affected near to the extent as the investment markets because the amount of new money entering CPI markets and GDP activities was much less than the amount of money entering the investment markets.
Now during this period, the Fed says rising asset prices was not “inflation.” Yet the cost of saving is skyrocketing as you have to save more to acquire a nest egg (because interest rates are so low). Eggs and cheese stayed cheap but saving for your future became almost impossible unless you speculated in the stock market. Does that sound like a no-inflation environment? Only if you have a very narrow and strange idea of what inflation is.
The point is, we had a lot of inflation during the QE years. It did not show up very much in consumer goods, but it was very evident in the investment markets.
There were a few CPI items where you DID see some price inflation. For example, look at the cost of college tuition, which is a very small element in the CPI. College tuition has risen at about 3 times the average rate of increase in the CPI. Can you guess why?
Go ahead and enter your answer in the chat space. Why would you say college tuition went up at more than double the rate of CPI inflation between, say 2008 and 2020?
If you guessed that college tuition rose because lots of new money was entering the market for college tuition, you get an A for class participation.
Here is the growth of student loans during that period, 2010 to 2022. Student loans almost tripled during this period. Most of this lending was done by the banks, supported by government guarantees rather than by the Fed’s QE program. What you see in the graph is mostly new money thrown at colleges, raising the demand for their services, and driving up tuition prices. Did the population triple? Did the number of students triple? Of course not. Public policy just threw money at colleges with a predictable increase in college costs.
So there is my main explanation of why we have seen, until very recently, lots of asset price inflation but much less consumer price inflation. It was largely a monetary factor. I hope you can now see why this new source of money from QE stayed mostly in the investment markets and raised asset prices, and did not immediately leak out into commodities or consumer goods in the form of soaring prices.
I should add that there was likely an additional, non-monetary factor that helped consumer prices stay low. That factor was a very positive economic factor. It was a surge in real productivity due to improved internet communications, international specialization of production, and cheap foreign labor. Online communications gave us Amazon, online car sales, better information, more efficient supply chains, etc. Inexpensive foreign labor and an expanding workforce (think China, Southeast Asia, India, etc) gave us much cheaper goods. This kept consumer prices from rising too fast. Without monetary expansion, consumer prices would likely have declined, as they did in other periods of great productivity like the late 19th century.
So I think the Fed tricked itself by thinking of inflation solely as consumer price increases. The slow rise in consumer prices, which was mistaken for “no inflation,” caused the Fed to think they could get away with money printing indefinitely without inflation when all the time asset price inflation was going on right underneath their noses.
So the fact is, we live in an inflationary world and have lived there for many years. Inflation didn’t just emerge in July of 2021, despite the Fed’s surprise and their claims that CPI inflation was transitory. Inflation has been with us, hiding in plain sight, for many years. It’s just that the price increases showed up first in asset prices. And it did so because that is where the money was directed - to asset purchases, year after year.
The damage done to the working class went unnoticed because for a while they did OK, stagnating, or barely getting ahead if at all, but at least they could afford eggs and cheese. Now, however, things have changed, lots of new money has been spent on consumer goods, and we have consumer price inflation coming out of our ears. What changed? How did new money get injected into consumer markets? Well, I am running out of time today, so I have to draw a line there, and we will save for a later day a discussion of how new money finally found its way to consumer prices causing the big inflation panic of today.
Let’s stop there and have some comments or questions.
HardmoneyJim No. 19