

Inflation Mind Tricks
THE 40-YEAR CON BEHIND THE INFLATION "NUMBER"

They Print the Money. You Pay the Price. Here’s How to Fight Back.
Most people will tell you that the number one economic problem of the day is inflation - by which they mean the rising cost of everyday living.
Would you be surprised if I said that inflation is NOT rising prices? Rising prices are a symptom of inflation, but just as a fever is not the same thing as the disease that caused it, rising prices are not the same thing as inflation itself.
Welcome back to HardmoneyJim. Let’s dive in and talk about the real meaning of inflation. If you prefer listening, there’s a YouTube version of this essay here.
I want to propose a trick. I am going to make the cost-of-living rise for every person in this country — quietly, without a vote, without a tax bill, without anyone’s signature on anything. And when prices go up, I am going to convince you that the problem is “greedy corporations,” or “disrupted supply chains,” or unusual weather — anything except the thing that actually did it.
This trick has a name: Inflation. What you may not know is that the word has been quietly redefined — and the redefinition is the trick.
Today I want to convince you of one idea: that inflation is not rising prices. Rising prices are a symptom. Inflation is something that happens to the money itself — and once you see it that way, you open your mind up to new understanding and new investment options.
PART ONE — THE NEW CHAIRMAN AND THE MOVING RULER
Let’s start with something that just happened.
Kevin Warsh has taken over as Chairman of the Federal Reserve — the single most powerful office in American economic life. And almost immediately, he signaled that he wants to change how we measure inflation to guide monetary policy.
Now, stop and sit with that for a second. The man whose job is to fight inflation would like to change the way he measures the thing he’s supposed to control.
Why does that matter? There isn’t one inflation number — there are several, and right now they disagree sharply as shown on the following chart. The numbers shown are as of the end of April.
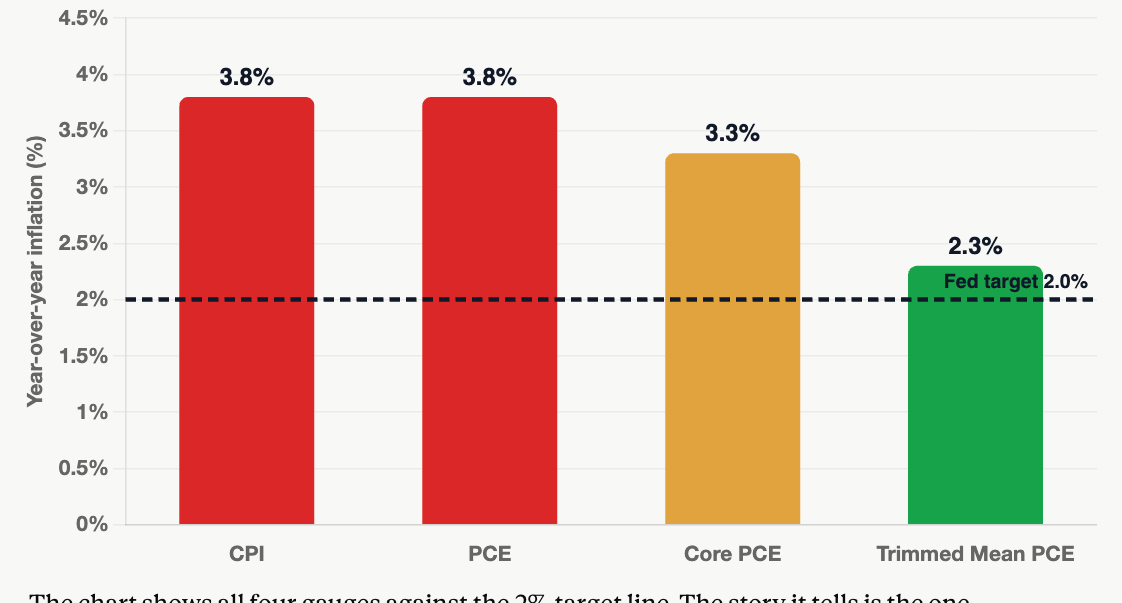
The Consumer Price Index — the CPI, the number on the left that you see in the financial headlines — came in at around 3.8 percent. The Fed’s own preferred gauge, called PCE (personal consumption expenditure) sits right next to it at a similar level. Next is “core PCE,” which has been the Fed’s favorite measure. Strip out food and energy — yes, the Fed’s favorite “core” measure does, incredibly, exclude the price of eating and heating your home — and you get about 3.3 percent. That’s Core PCE.
But Kevin Warsh’s preferred measure — the Dallas Fed’s “trimmed mean” PCE, which throws out the most extreme price changes, both upward and downward— came in around 2.3 percent. That’s the green bar.
Notice that every one of those numbers is well above the Fed’s sacred 2 percent target, shown by the horizontal dotted line.
Do you see what just happened? Of all the available numbers, the new chairman has reached for the one that puts inflation almost exactly at target — right as he takes the helm and right as there’s pressure on him to cut interest rates.
I want to be fair here: the trimmed mean is a legitimate statistical tool. Reasonable economists use it to separate signal from noise. Even its defenders, though, have noticed the problem. The Dallas Fed’s own researchers have cautioned against leaning too hard on that low reading right now, because when price increases are lopsided to the upside — as they have been — trimming can hide price upward pressure that’s actually building.
So this isn’t a conspiracy theory. It’s just a question. When the person measuring the thing gets to choose the ruler, and chooses the ruler that makes the number look best for him — should you trust the number, or should you ask what the ruler is made of?
PART TWO — THIS HAS BEEN GOING ON FOR DECADES
And here’s the thing — Warsh is not the innovator here. He’s the latest in a long line. The Bureau of Labor Statistics, which publishes the CPI, has been quietly reshaping the inflation ruler for decades. In fact, over the last 40 years, they have altered their calculation method 25 times.
I’m not going to claim that all these changes were sinister. Some were defensible. But historically, they almost all push in the same direction — they make measured inflation lower.
According to Grant’s Interest Rate Observer, out of 25 such updates since 1983, only 4 resulted in an upward revision in the reported price data. In general, the more sophisticated the index becomes, the more favorable the reported inflation data appear.
If you want more detail on when and how the BLS pulled off these revisions, you can see Chapter Seven of my book, A Black Hole in Economics. That chapter is titled, provocatively, “The Arsonist and the Fireman.”
So how do we trust this data, and what is the “real” inflation rate?
Here is where I want to turn the whole conversation, because even this manipulation of the statistics misses a deeper point. We are arguing about how best to measure rising prices. And I want to suggest that rising consumer prices were never the right definition of inflation in the first place.
PART THREE — THE SYMPTOM IS NOT THE DISEASE
The better question is: Is a rise in prices even the right way to think about inflation?
Price is a measure, and it matters. I’m not telling you to ignore the price of groceries. But if you stop there — if the whole of your understanding is “inflation equals rising prices”— you will be thrown off the scent of what’s really happening to you. If rising prices are inflation, then anything that causes prices to rise can be called a cause of inflation. Thus, we have economists talk about “inflation” caused by wars, oil price increases, and climate change. These phenomena can and do cause certain prices to rise, but they are different from what we normally experience as inflation.
Think about it like a fever. You’re sick with a fever. A fever is real. It’s measurable. You should pay attention to it. But if a doctor treated only the fever with ice baths or cold towels, without asking what infection is causing it, you’d be smart to find a new doctor.
Rising prices are the fever. They are the visible, lagging, downstream symptoms. And by the time the fever shows up in the CPI, the disease has already been spreading through the body of the economy for months or years — doing damage that a price index will never show you.
So if rising prices are the symptom, what’s the disease?
To answer that, we need to do something the Fed and the BLS never invite you to do. We need to define our terms based on fundamentals.
PART FOUR — DEFINING INFLATION
So, let’s define inflation honestly. Here’s a principle. A good definition of any concept rests on its most fundamental characteristic — the attribute that distinguishes that concept from everything else. Not its side effects. Its essence.
So let’s go back to the word itself. Inflation. To inflate. To blow up, to swell, to expand, to increase.
Inflate what? According to my own Oxford English Dictionary, dated 2002, “inflation” is defined as “an undue increase in the quantity of money circulating, in relation to the goods available for purchase.” For most of the word’s history, as it is used in economics, “inflation” did not mean rising prices at all. It meant an inflation of the money supply — literally, a swelling of the quantity of money in circulation. Rising prices were understood as a consequence of that swelling, not the thing itself.
The great economist Ludwig von Mises identified this semantic problem many years ago: people started using the word inflation to describe the consequence — rising prices — and in doing so, lost the ability to identify the cause. And when you lose the word for the cause, he warned, you lose the ability to even talk about it. There’s no longer a term for the thing the government is actually doing.
Another great modern economist, Milton Friedman, tried to identify the problem, but slightly missed the mark, in my view.
“Inflation is always and everywhere a monetary phenomenon,” he said, and “Inflation is too much money chasing too few goods.”
These statements are generally true, but they still don’t get to the essence of the problem. Friedman’s definition assumes that inflation is widespread price increases, which is not really an essential definition. It’s true that Inflation is not a grocery phenomenon and not a corporate-greed phenomenon. It’s a “monetary phenomenon” for sure. But what if prices increase because there are “too few goods,” such as due to a crop failure. Is that inflation? Friedman’s description tells us that price increases come from both too much money and too few goods. Unfortunately, it leaves out the many other adverse effects of excessive money creation.
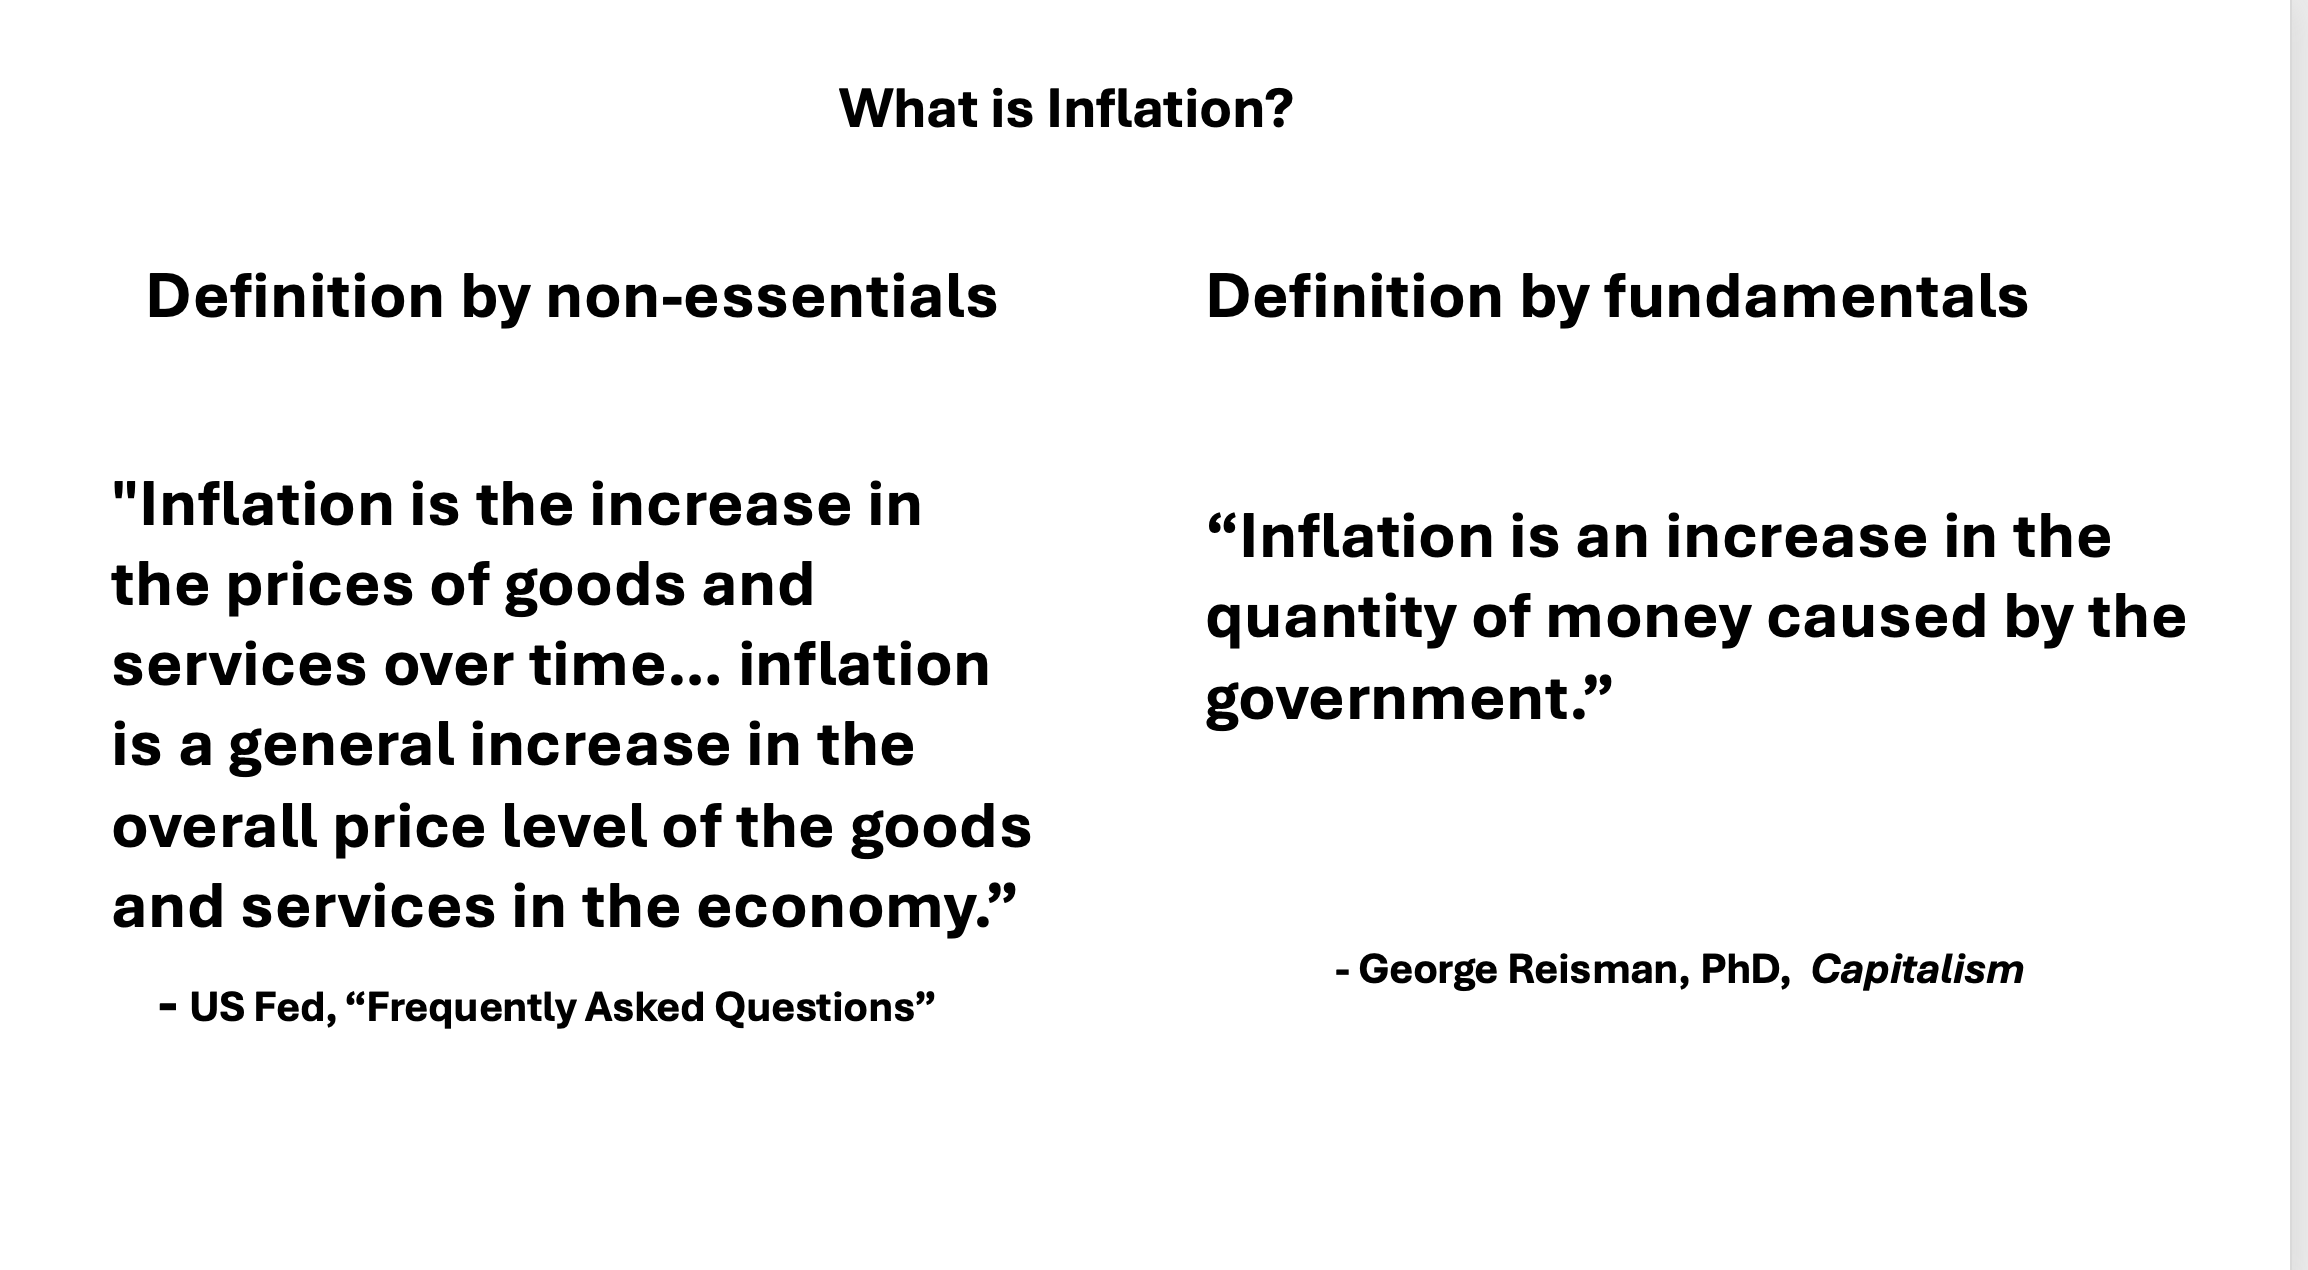
So here is the definition my analysis is built on, and I have compared it to the U.S. Federal Reserve’s definition.
On the left is the Fed’s definition of inflation from their own handbook. Inflation, they say, is an increase in the prices of goods and services over time.
Now look on the right side of the panel. Inflation is an increase in the quantity of money, brought about by government and central bank policy.
Or, more tersely and, I believe, equivalently: inflation is an unproductive increase in the money supply — money created out of nothing that is not supported by any new production of real goods and services.
Why does the term “unproductive” matter? If the supply of money grows naturally alongside the supply of economic goods, prices remain stable and the economy grows. The problem comes when there is new money, conjured from nothing, that doesn’t correspond to any new wealth. That’s the actual disease. Rising prices are just one symptom that eventually shows up on a chart.
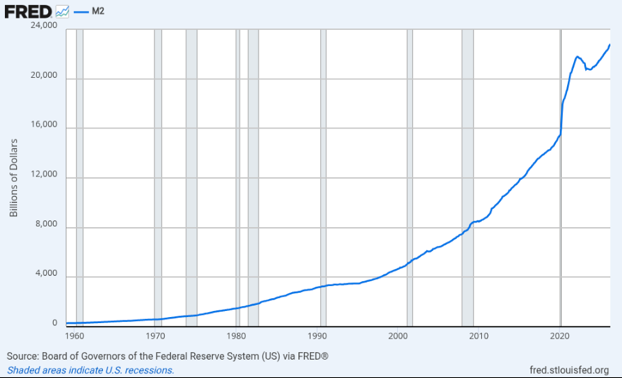
If you want to see the disease instead of the symptom, don’t look at the CPI or other price indexes. Look at the money supply, especially the right side of this chart from the Fed, where the money supply spikes up. In only two years during the pandemic, the broad money supply expanded by roughly 40 percent. That means over 25% of all the dollars that had ever existed were created in about twenty-four months.
Fed chairs Janet Yellen and Jerome Powell, who falsely identified inflation as rising consumer prices, didn’t see it coming. Why? Because they were used to pumping money into the economy from 2009 to 2022, and this resulted in only moderate increases in consumer prices. But they had succeeded in pumping up the prices of stocks, bonds, and houses. That was where their inflationary policies caused the first price increases – in assets. But since, to them, inflation is only rising consumer prices, they concluded that money pumping would not cause consumer prices to break out to the upside.
But here’s the key point: the money explosion was the inflation. The asset and consumer price increases that followed were just the fever finally spiking.
PART FIVE — THE DAMAGE PRICES DON’T SHOW
Once you define inflation as excessive monetary expansion, something powerful happens. You can suddenly see all the other damage it does — damage that a consumer price index, by itself, can never capture.
Rising prices are only adverse effect number one. We’ve covered this. It’s real, it’s damaging, it’s the part everyone sees. But it’s the least interesting part, and it’s the only part the official conversation will let you discuss.
Effect number two is the distortion of economic signals — and the resulting misallocation of capital. This is the big one, and it’s the one almost nobody talks about. Prices are not just numbers. Prices are information. An interest rate is the most important price in the whole economy — it’s the price of time, the signal that tells entrepreneurs whether people are saving for the future or spending now.
When the central bank causes the commercial banks to create money and pushes interest rates below their natural level, it changes that signal. It tells every business in the country that there’s more real savings available than there actually is. So they build. They borrow. They launch new projects, hire the workers, pour the concrete — all based on a distorted price signal.
And when the illusion finally collides with reality, those projects are revealed as “malinvestments” — capital sunk into projects nobody can afford to maintain over the long haul. We have a name for the cleanup process. We call it a recession. The boom is the inflation doing its damage; the bust is the discovery of the damage. None of that shows up in the CPI. The net result of this malinvestment boom-bust is slower or stagnant economic growth and, overall, less prosperity, especially for those who do not own assets.
Here’s a chart of asset prices (in green and yellow) versus median income (in blue). Pretty clearly, since the Fed started QE in 2009, you’d rather be an asset owner than a working stiff.
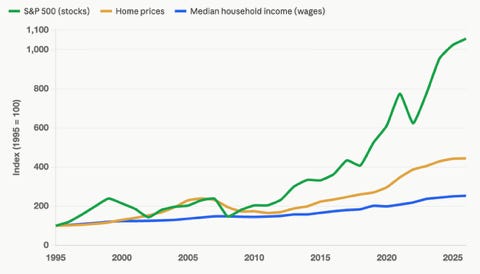
And that illustrates adverse effect number three, the unjust redistribution of wealth. New money does not enter the economy evenly, like a gentle rain falling on everyone at once. It enters at specific points and goes to specific people — through the banks, through the financial system, through government spending. Wages are typically the last prices to adjust. So for years, working people run on a treadmill: the cost-of-living climbs first, and their paycheck catches up — if it ever does — only later, after the purchasing power has already been drained out of it. The raise feels like progress. It’s often just running to stay in place.
This is the moral heart of inflation. Three centuries ago, an economist named Richard Cantillon noticed something that still bears his name – the Cantillon Effect. Because new money always enters at a specific point in the economy. Whoever gets it first wins, and whoever gets it last loses.
Under inflationary money creation, who gets the new money first? Banks. The government. Professional investors. Large corporations with access to cheap credit. And the people who already own assets — stocks, real estate, the things that usually get bid up first when new money sloshes in – are the ones who immediately benefit from the higher asset prices.
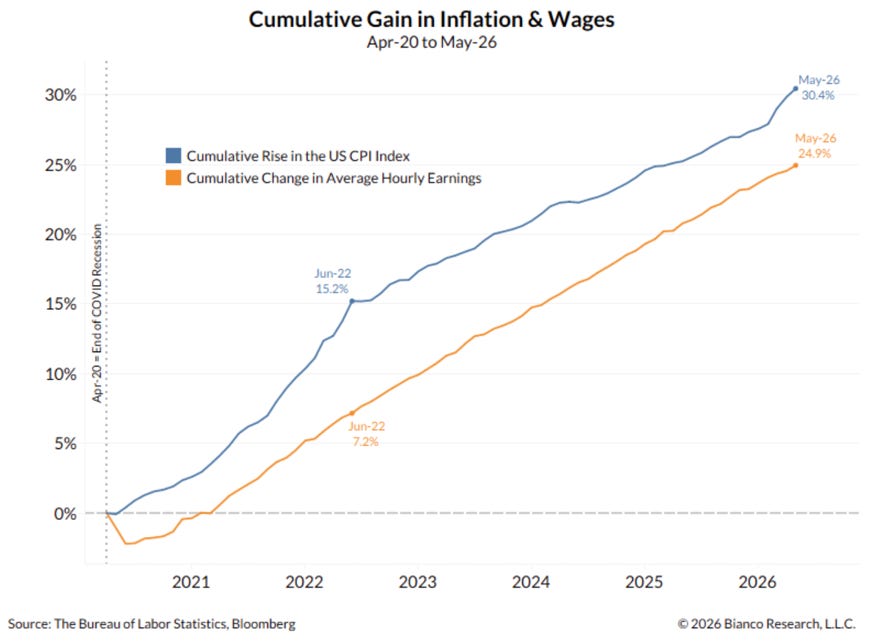
Who gets the new money last? Typically, it’s wage earners. Traditional savers. People on fixed incomes. The poor. People holding cash in a bank account, watching its purchasing power quietly evaporate. They get the new money only after prices have already risen — if they get it at all. The chart above, from Bianco Research, shows how wage hikes (the orange line) have persistently lagged the overall consumer price index since the big COVID money-printing scheme began in 2020.
So among other things, inflation is a transfer. A vast, silent, unvoted transfer of wealth — from the bottom and the middle, up to the top, and from the future to the present. It is, functionally, a tax. But it’s a tax that was never legislated and never appears on a single bill. That’s why it’s been called the cruelest tax of all. And again — none of it appears in the inflation number they ask you to argue about.
That’s why the definition matters so much. Define inflation as “rising prices,” and the whole debate shrinks down to which thermometer to use. Define it as monetary expansion, and you can finally see the fever, the infection, the malinvestment, the stagnant wages, and the great upward transfer — all at once, and all from one cause.
PART SIX — HOW TO PROTECT YOURSELF
So, understanding what inflation is and what its effects are, what can we do about it?
You and I can’t stop the printing press. And unless voters wake up, they can’t vote it away. But we are not helpless.
The best strategy follows directly from the diagnosis. If the problem is that the purchasing power of money is being diluted as the money itself is swelled, inflated, created from nothing — then the defense is to hold a form of money that cannot be created from nothing.
For thousands of years, across every civilization that ever tried it, that has meant precious metals. Gold and silver can’t be conjured by a committee. No central bank can print them into existence. Their supply grows slowly, through real work — mining real ore out of the real ground. That is precisely the property that makes them a historical store of value when paper currencies are being inflated.
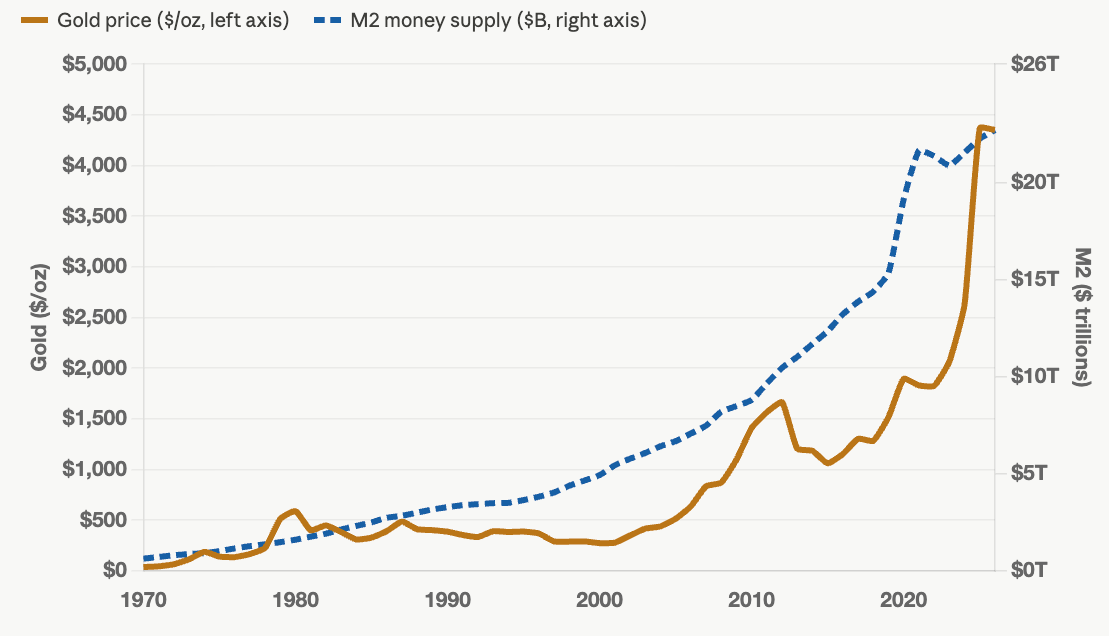
Look at the long arc of the gold price versus the money supply, and you’ll see it. Since 1970 (what I call the “post-gold” era), as the money supply has swelled, the price of gold has broadly risen to keep pace. Not in a straight line — it moves in violent bursts and long quiet stretches, and anyone who tells you it goes up predictably is smoking something. But as a multi-decade hedge against the dollar’s dilution, precious metals have done what savings accounts predictably fail to do.
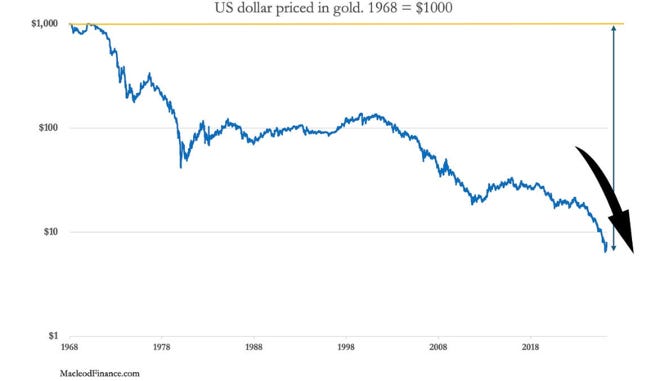
Looking from the opposite side, here is a chart from Alasdair Macleod of the dollar priced in gold. It shows how much gold $1000 would have bought just prior to the end of the gold era, then traces the declining ability to purchase gold in dollars. This chart says you can save, long term, in gold, but not in dollars. In the post-gold era, the dollar has lost about 95% of its value. This trend is inevitable, and it must continue, albeit with unpredictable surges and pullbacks.
I’m not your financial advisor, and this isn’t a promise of a return. What I am saying is that incorporating precious metals into your savings and investment program is a way of opting, at least in part, out of the government’s trick, which says inflation is just rising prices.
It’s kind of a financial Jedi mind trick. The trick says. “A CPI increase is the inflation you should be looking for.”
The inflation you should be looking for is an increase in the quantity of money itself.
So next time you hear that inflation is “under control” because some trimmed, adjusted, food-and-energy-stripped index ticked down a tenth of a percent — ask the better question.
So don’t just ask: “What are prices doing?”
Ask also: “What is the money doing?”
Because once you understand that inflation is not just the prices rising, but the money itself being inflated — the only real question left is whether you want to keep your savings in the thing being diluted, or in something that isn’t.
Thanks for reading and watching. Don’t forget to “like” below, and please subscribe to the HardmoneyJim YouTube channel.
June 23, 2026
Absolutely awesome! This really nails it and is the best and briefest definition of this problem I've ever seen. And, more importantly, it highlights all the damage inflation does via malinvestment and unfair wealth transfer, which is truly far more significant to the overall health of our economy and, frankly, our society. Perhaps you could develop or use an already developed measure of money supply and put the increases of that out at the same time the government publishes the CPI to demonstrate what is really going on vs. what the government would like to con you into believing.
Excellent article. One of the things I appreciate most is that it returns the discussion of inflation to first principles. Too much economic commentary today is consumed with debating statistical outputs while neglecting the more fundamental question of what inflation actually is. By focusing on definitions, causes, and incentives rather than merely on reported numbers, you bring the conversation back to where it belongs.
One thought that came to mind while reading was George Orwell's observation that language is never neutral. Whoever defines the terms of a debate often shapes the debate itself. The discussion around inflation is a good example. If inflation is defined as rising prices, attention naturally focuses on measuring prices. If it is defined as an expansion of the money supply, attention shifts to monetary policy. That is why definitions matter so much. They do not merely describe reality; they influence how people understand it and where they look for explanations.
My second thought concerns incentives. Whenever a statistic evaluates an individual or institution, there is an almost unavoidable temptation to emphasise the measure that casts performance in the most favourable light. This is not necessarily evidence of bad faith; it is simply human nature. Investors encounter this constantly in corporate reporting, and policymakers are no different. For that reason, I believe it is always wise to look beyond any single headline number and ask not only how it is calculated, but also what incentives may influence its construction and interpretation.